> For the complete documentation index, see [llms.txt](https://learnphp.gitbook.io/learnphp/llms.txt). Markdown versions of documentation pages are available by appending `.md` to page URLs; this page is available as [Markdown](https://learnphp.gitbook.io/learnphp/learn-lavarel/laravel-9-highcharts-example-tutorial.md).
# Laravel 9 Highcharts Example Tutorial
## Laravel 9 Highcharts Example Tutorial
By Hardik Savani March 16, 2022 Category : LaravelPauseUnmuteLoaded: 1.00%Fullscreen[](https://vdo.ai/?utm_medium=video\&utm_term=itsolutionstuff.com\&utm_source=vdoai_logo)Hi Dev,
This tutorial is focused on laravel 9 highcharts. you'll learn laravel 9 highcharts ajax example. This post will give you a simple example of how to create chart in laravel 9. This post will give you a simple example of how to use highcharts in laravel 9.
you can simply use Line Charts, Bar Charts, Pie Charts, Area Charts, etc using highcharts js.
Highcharts is a js library, this library through we can use bar chart, line chart, area chart, column chart, etc. Highcharts is a open-source chart library. Highcharts also provide several theme and graph that way you can use more chart from here : [HighCharts Site](http://www.highcharts.com/).
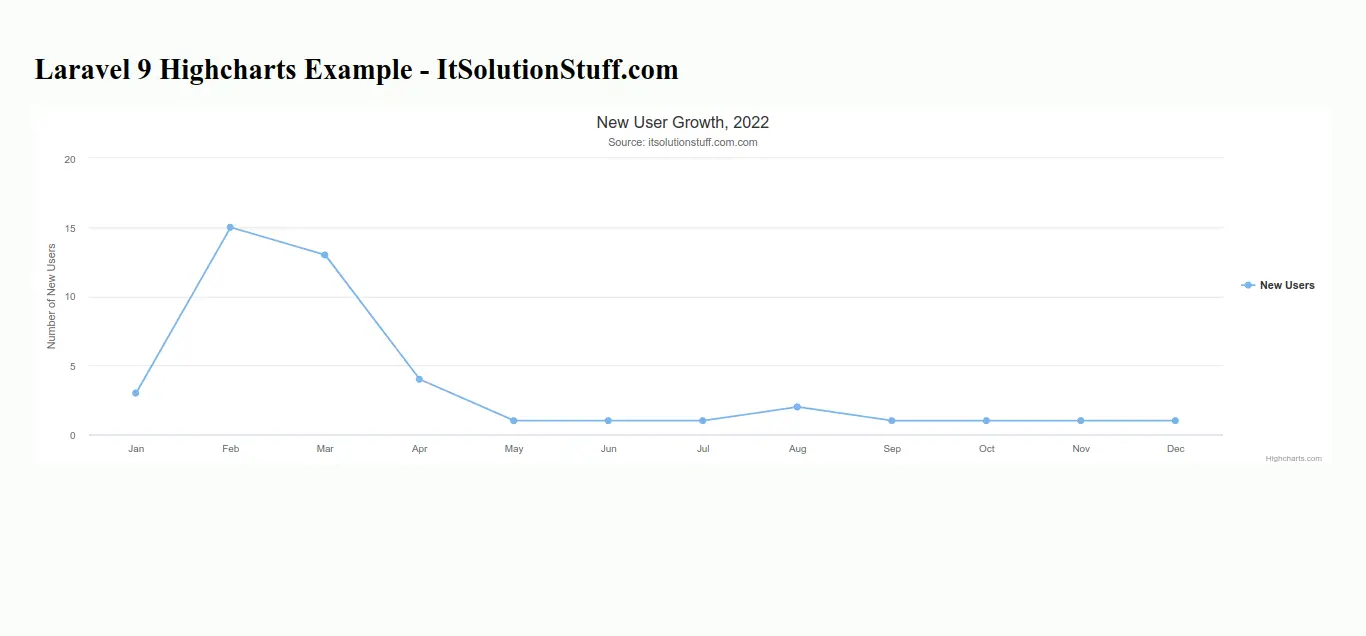
In this example, we will create some dummy users records and then we will display a line chart with all months of current years. so let's follow the below step and add a chart in your laravel 9 app.

**Step 1: Install Laravel 9**
This is optional; however, if you have not created the laravel app, then you may go ahead and execute the below command:
```
composer create-project laravel/laravel example-app
```
**Step 2: Create Route**
first of all we will create simple route for creating simple line chart. so let's add simple routes as like bellow:
routes/web.php
```
whereYear('created_at', date('Y')) ->groupBy(DB::raw("Month(created_at)")) ->pluck('count'); return view('chart', compact('users')); }}
```
**Step 4: Create Blade File:**
here, we need to create blade file and in this blade file we use highchart js and use their code.
resources/views/chart.blade.php
```
Laravel 9 Highcharts Example - ItSolutionStuff.com Laravel 9 Highcharts Example - ItSolutionStuff.com
```
**Step 5: Create Dummy Records:**
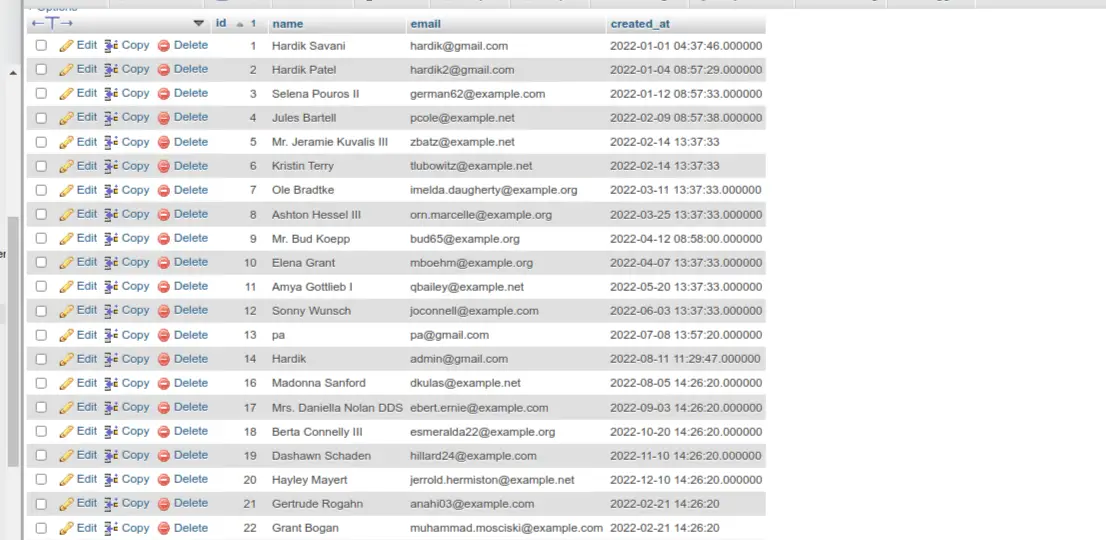
Here, we need to add some dummy records on users table as monthly wise.
you can create dummy records using laravel tinker command as bellow:
```
php artisan tinkerUser::factory()->count(30)->create()
```
You need to create users on each month with created date as like bellow screen shot:
**Run Laravel App:**
All the required steps have been done, now you have to type the given below command and hit enter to run the Laravel app:
```
php artisan serve
```
Now, Go to your web browser, type the given URL and view the app output:
Read Also: [Laravel 9 Summernote Editor with Image Upload](https://www.itsolutionstuff.com/post/laravel-9-summernote-editor-with-image-uploadexample.html)
```
http://localhost:8000/chart
```
Output:
I hope it can help you...