
How to add charts in Laravel using Chart JS ?
https://www.itsolutionstuff.com/post/how-to-add-charts-in-laravel-5-using-chart-js-example.html
How to add charts in Laravel using Chart JS ?
By Hardik Savani April 22, 2016 Category : Laravel Chart JS PlayUnmuteLoaded: 1.17%Fullscreen
 If you need to see example of laravel chartjs. it's simple example of laravel chartjs ajax example. if you have question about how to create chart in laravel then I will give simple example with solution. In this article, we will implement a how to use chartjs in laravel.
composer create-project laravel/laravel example-app<?php use Illuminate\Support\Facades\Route; use App\Http\Controllers\ChartJSController; /*|--------------------------------------------------------------------------| Web Routes|--------------------------------------------------------------------------|| Here is where you can register web routes for your application. These| routes are loaded by the RouteServiceProvider within a group which| contains the "web" middleware group. Now create something great!|*/ Route::get('chart', [ChartJSController::class, 'index']);<?php namespace App\Http\Controllers; use Illuminate\Http\Request;use App\Models\User;use DB; class ChartJSController extends Controller{ /** * Write code on Method * * @return response() */ public function index() { $users = User::select(DB::raw("COUNT(*) as count"), DB::raw("MONTHNAME(created_at) as month_name")) ->whereYear('created_at', date('Y')) ->groupBy(DB::raw("Month(created_at)")) ->pluck('count', 'month_name'); $labels = $users->keys(); $data = $users->values(); return view('chart', compact('labels', 'data')); }}
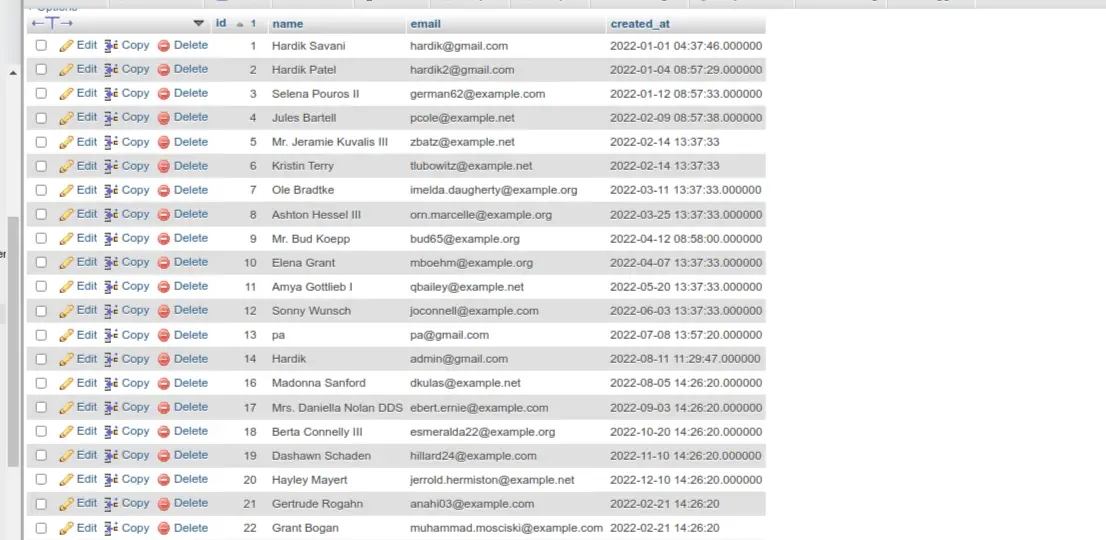
 You need to create users on each month with created date as like bellow screen shot:

Last updated